Linegram
The most immediate way to understand a collection of numbers is to plot them as tick marks on a number line.

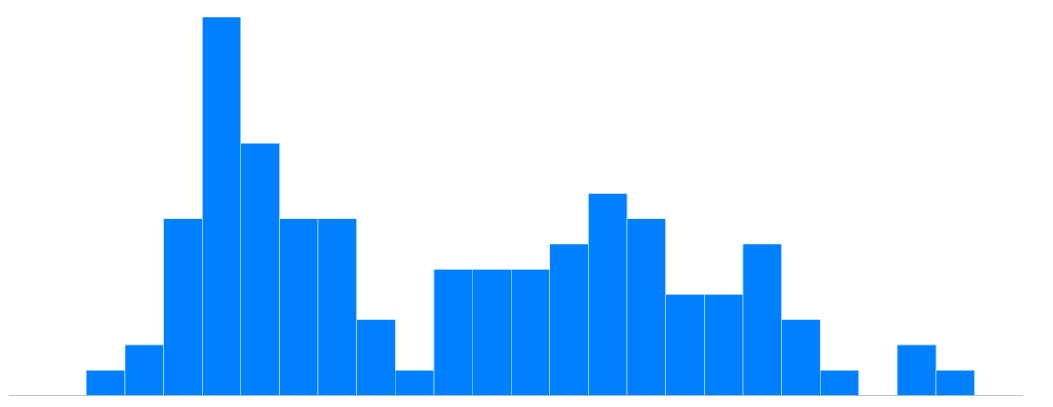
A linegram is a collection of tick marks, with the height of the tick mark at \(x\) equal to the number of tick marks between \(x-r\) and \(x+r\), for some value \(r\).

Compare this to a histogram of the same data, with bins of width \(2r\).
By taking appropriate limits, both linegrams and histograms can reveal the probability distribution of a random variable. For practical work with real data, the linegram has the advantage of showing exactly where each data point is. For this reason, the linegram is especially useful for understanding smaller data sets, or data sets with sparse regions.